Relationship Panoramic Inventory (RPI)

Relationship Panoramic Inventory is designed and validated to assess the relationship health and strengths of couples 21 years and older who are in intimate long-term relationships for at least 12 months.

There is no maximum limit for how long a couple has been together. As you see from the statistics below, we studied couples with average relationship length of 10 years and up to 42 years.

Please note the diversity of gender, sexual orientations and relationship types of this sample. To get the most out of this assessment, please ask your clients to have one primary relationship in mind when taking the test rather than multiple partners that they might be engaged with.

The educational background of the individuals and couples that we studied represents the US demographic norm; however, the language level of the Inventory is at high school diploma level and higher. We are currently studying and validating the test for other languages and cultures around the globe.

Basic Characteristics of Individuals and Couples that We Studied (representative of the US norm)

Validation Study Sample Size

0
Individuals
0
Couples

Age Range and Average

21
Age Average
19- 19
Range in Years

Relationship Length Range and Average

0
Relationship Length Average
1- 1
Range in Years

Gender Mix

0 %
Female
0 %
Male
0 %
Non-Binary

Racial Mix

0 %
White/Caucasian
0 %
Black/AfricanAm.
0 %
Asian and Multiracial

Educational Backgrounds

0 %
High School
0 %
College Degrees
0 %
Advanced Degrees

Relationship Status

0 %
Married
0 %
Engaged
0 %
Cohabiting/Dating
0 %
Civil Unions or Partnerships
0 %
Open Relationships

Sexual Orientations

0 %
Heterosexual
0 %
Bisexual
0 %
Lesbian
0 %
Gay
0 %
Pansexual
0 %
Queer

Relationship Orientations

0 %
Monogamy
0 %
Monogamish
0 %
Open & Polyamory

Relationship Panoramic Inventory is a self-administered online assessment with the following scales and measures that can be completed within 20-30 minutes.

Relationship Vision and Metaphors

10 items to determine one’s vision for a relationship, plus 10 relationship metaphors that summarizes the roles that couples in relationships adopt (e.g. best friends, sex partners, lovers, etc.).

Emergent Love Scale

17 item scale to assess core outcomes (fit, thriving, satisfaction), interpersonal dynamics (respect, compassion, love, commitment and trust) as well as mutual physical attraction.

Sexual Health and Satisfaction Scale

18 item scale to assess satisfaction with frequency and quality of sex, consensual sex, as well as the indications for most common sexual dysfunctions.

Healthy Living and Lifestyle Scale

11 item scale to assess one’s sense of mental, emotional and physical health, healthy lifestyle choices as well as indications for alcohol, smoking and other substance use.

Positive and Negative Emotions Scale

20 item scale to assess one’s tendency toward most common positive and negative emotions.

Positive and Negative Thoughts Scale

10 item scale to assess one’s tendency toward most positive vs. negative thoughts.

Ability to Connect Scale

14 item scale to assess 4 aspects of one’s ability to connect: respect & manners, dress & looks, touch & affection, mood & tone.

Personal Values Scale

32 item scale to assess one’s core personal values, with a focus on moral values as a predictor for better relationship outcomes.

Thinking Styles Scale

12 item scale to assess behaviors associated with more streamlined thinking: abstraction, facilitation, information and organization.

Healthy Financial Attitude Scale

7 item scale to assess one’s attitude toward managing personal finances, spending and saving.

Identity, Interests, Temperaments

7 measures to assess adverse childhood events, personal identity, interests (general, political and religious), and temperaments.

Handling Conflict, Stressors, Outlook

7 more measures to assess relationship stressors, conflict management, level of resentment and relationship mental models.

What is in the report and model?

Relationship Panoramic Schematic ModelUnderstanding the following two concepts are core to understanding the report and the model depicted on the right:

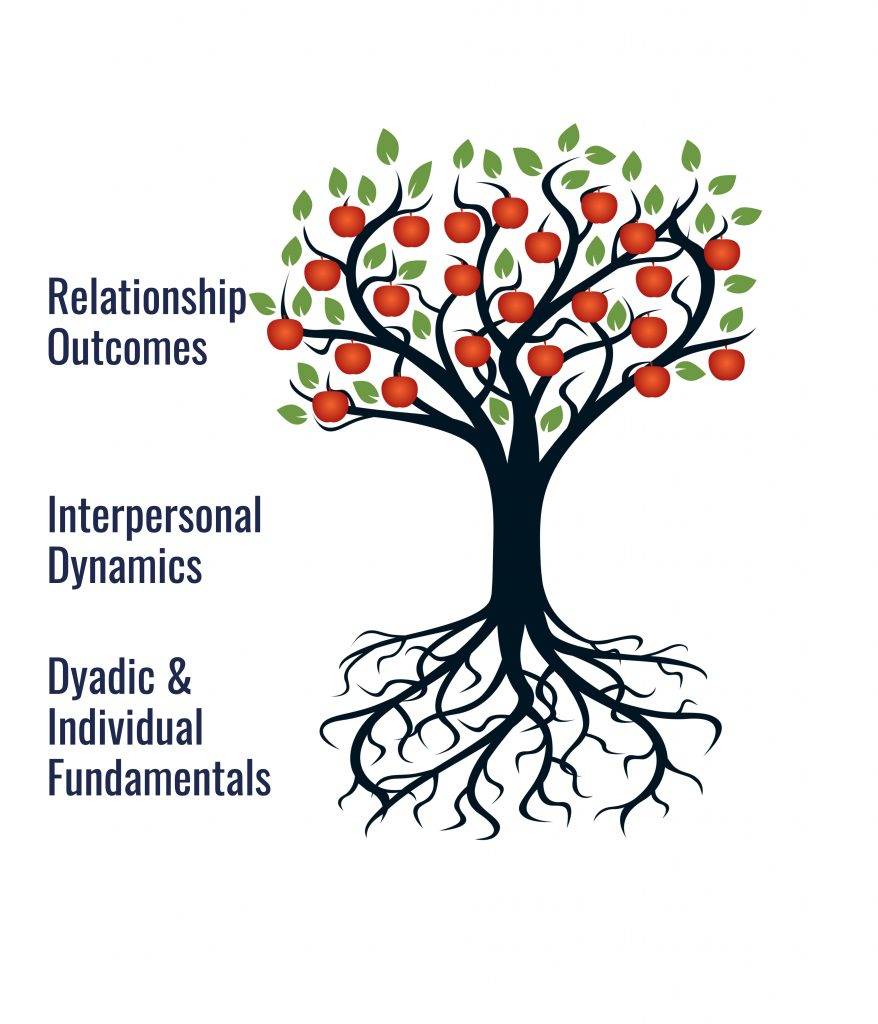
  1. A panoramic assessment of a dyadic relationship inherently requires an assessment of the following 4 buckets or domains:
    • how a couple subjectively view and perceive the outcome of their relationship,
    • how they interact on a daily basis,
    • their compatibility as a dyad (e.g. having a shared vision), and
    • certain individual characteristics (e.g. moral values). This is the essence of the model, which is informed by our research and depicted in the schematic below.
  2. Relationship Panoramic is primarily a strength-based model. It means that although you would see in the report where the cracks and fault-lines of a relationship might be, but the main focus is going to be the understanding of the relationship’s strengths and how to leverage them to sustain and promote a healthy and thriving partnership.

What areas are measured in each domain?

The executive summary of the report highlights the strengths and areas that may require some improvement in a couple’s relationship.

If the test is taken as a couple, scores of the two individuals are compared side by side in figures and tables against a population norm derived from our US validation study. This will make the report a lot easier to digest. 

The degree of commonness and difference for the reported measures will also be analyzed and presented.

How does it work?

There are two ways to order the test:

  1. A mental health provider or certified professional recommends the test to a couple.
  2. A couple directly orders the test.

In the first case, the therapist, counselor or certified coach will recommend the test to a couple client using this Instant Referral Form. After the clients order and take the test, the provider will receive the interpretive report from Relationship Panoramic’s analytics team and goes over the results in their next session with the couple. In our experience, some providers use the report to inform their ongoing treatment plan and clarify milestones for counseling the couple. It takes at least 2 hours to fully explain the 4 domains of the report. You might need extra time to address any questions that may arise based on this conversation.

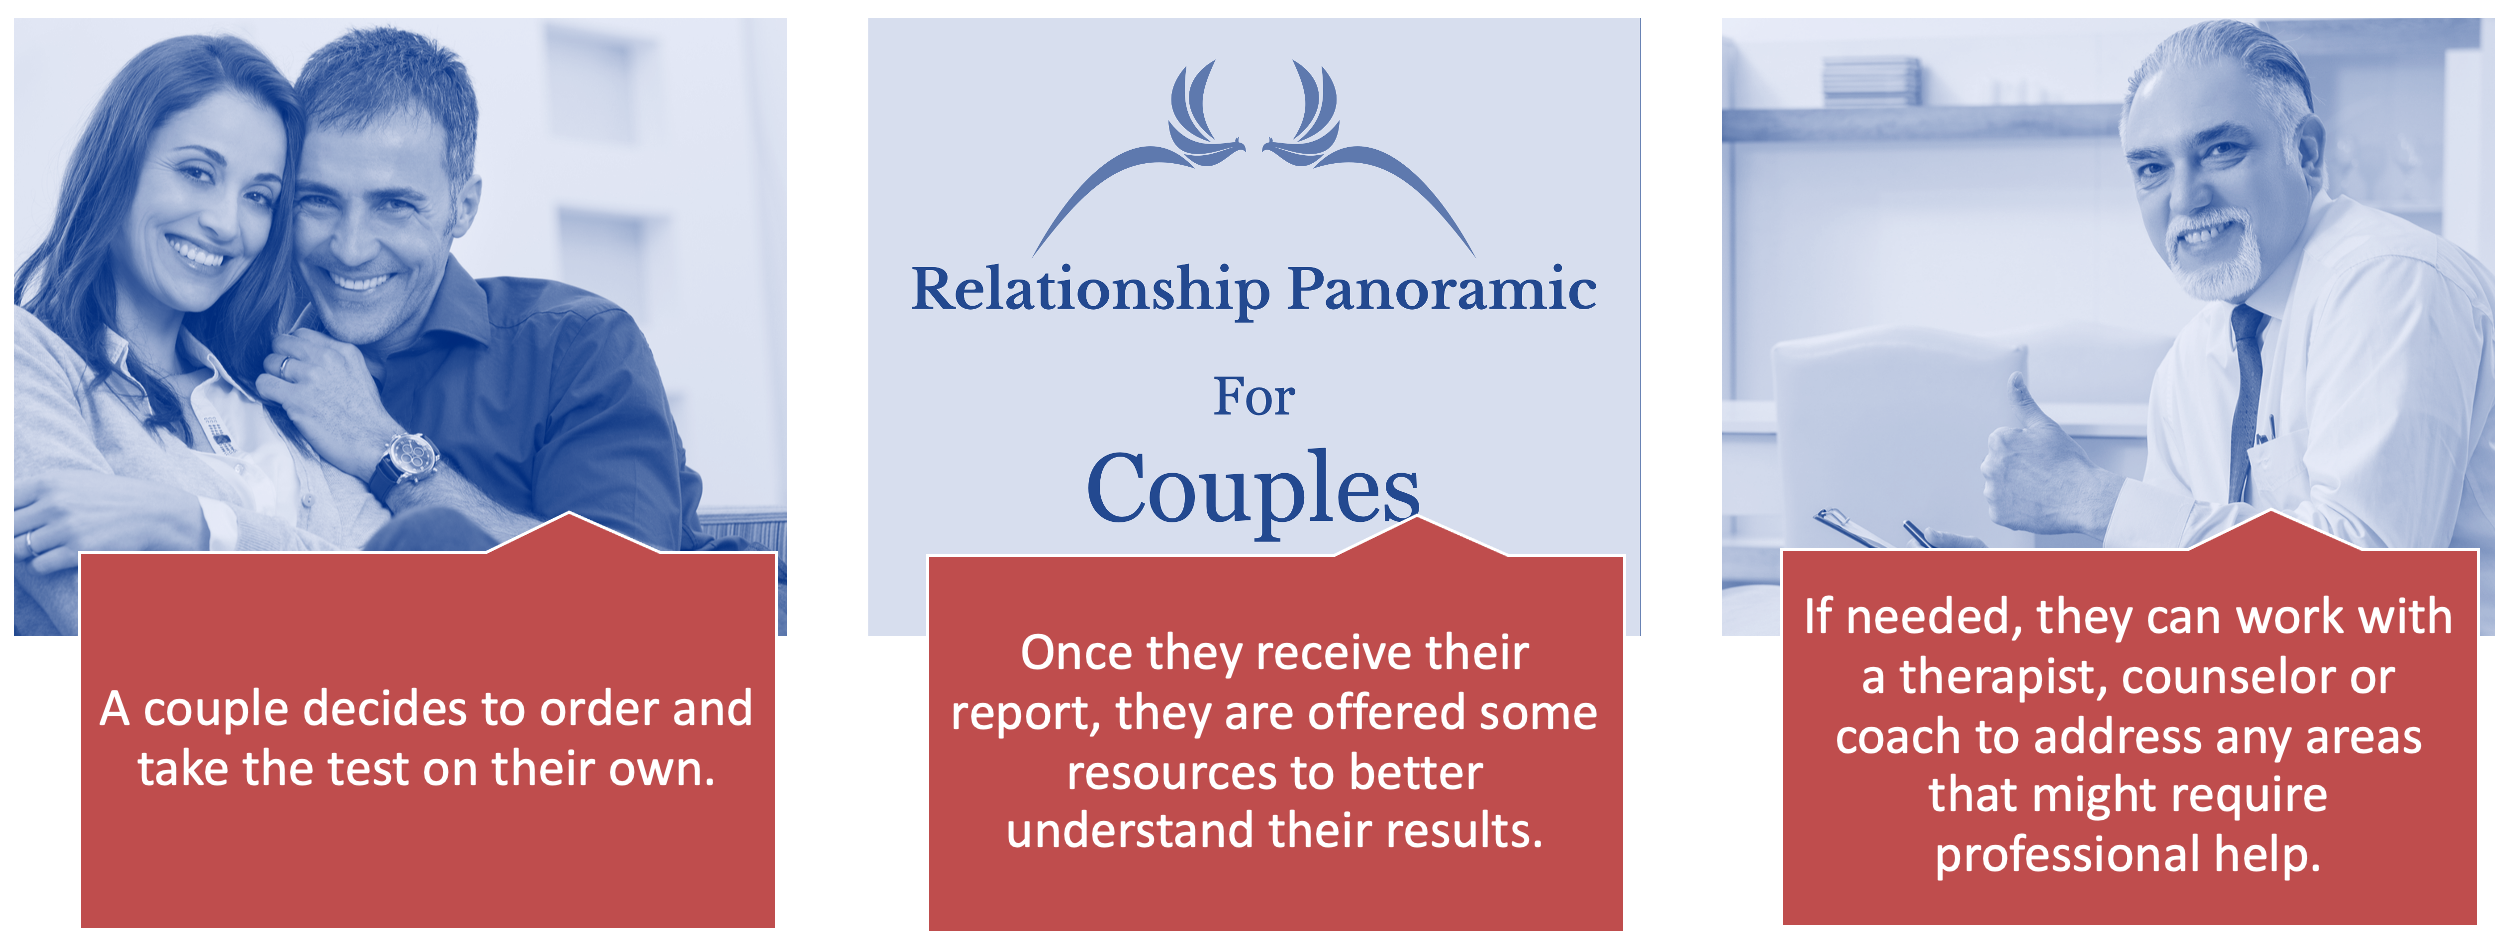
In the second case, a couple decide to order the test, take it on their own, and receive their report with descriptions about areas of strength and areas that might need improvement.

They are offered some resources to better understand the domains included in the report and have a better understanding of what they entail. If interested, they can start working with a therapist, counselor or certified coach to address any areas that might require professional help.

If you took the test but don’t know a clinician or professional to work with, please contact us to receive a list of approved professionals who might be able to help you and your partner.

Why does it matter?

For Clinicians and Professionals

  1. Relationship Panoramic is an affordable, simple and scientifically validated tool to assess modern-day relationships in a holistic manner.
  2. Your clients can respond to all 558 items in this inventory within 30 minutes.
  3. The interpretive report is easy to follow and yet detailed enough to help you develop an effective therapeutic plan for couples counseling and psychosexual therapy.
  4. It helps streamline and inform the initial assessment and intake session with your clients. It is applicable to the queer community as well as those in open or polyamorous  relationships.
  5. It can be used in premarital counseling if the couple has been together for at least a year.
  6. Relationship Panoramic is not a diagnostic, prognostic or screening tool for any mental disorders.

For Couples

  1. Relationship Panoramic is a clinical-grade inventory, which is also available to anyone in a relationship (married, engaged, cohabiting, dating seriously).
  2. In any relationships there are cracks that if left unattended, can turn into chasms. Relationship Panoramic is designed and validated to identify those cracks and highlight your relationship strengths.
  3. Many couples seek help when they are already worlds apart. Knowing the cracks at any stage and intentional work on them can help to prevent drifting apart.
  4. The main promise of the test is to increase your self-awareness as it relates to your primary relationship. This process starts from the time that you start going through the test and continues when you receive the report.
  5. Your report is a visual representation of your and your partner’s scores in comparison to the normative sample that we studied so you know where you stand.
  6. About 1/3 of couples who took the test did it prior to getting married and 2/3 at some point after marriage.
  7. Many couples take the test every 6 -12 months to reassess their coupledom with their providers over time.

The Science of Relationship Panoramic

In the charts below, red represents 25th percentile, yellow somewhere between 25th and 75th percentiles and green is above 75th percentile. The gauge shows the median value in our sample.

Methodology

The results of a retrospective qualitative study with 312 couples was the basis for item generation of Emergent Love Scale, which is discussed elsewhere.

In the validation study, 345 US individuals (representing 159 couples) in long-term intimate relationships were recruited through Amazon’s Turk Prime service in August 2019. They completed the original Relationship Panoramic Inventory with 200+ items in addition to 4 other scales for criterion validation, namely Couple Satisfaction Index (CSI), Revised Dyadic Adjustment Scale (RDAS), Love Attitude Scale and Experiences of Close Relationships (revised). We used factor analysis (extraction method: Principal Axis Factoring, rotation method: Promax and Oblimin with Kaiser Normalizations) to establish test validity and Cronbach’s alpha for test reliability. This US representative sample was also inclusive of a diverse sexual and relationship orientations.

Interpersonal Dynamics

61% and 56% of the total variance was explained using the Initial Eigenvalues and Extraction Sums of Squared Loadings, respectively. Cronbach’s alpha in the reliability analysis was 0.921. Interpersonal Dynamics was highly correlated with couple satisfaction as measured by CSI (Pearson correlation coefficient of 0.751, p<.001), dyadic adjustment as measured by RDAS (r = 0.689, p<.001), Eros and Apage types of love (r = 0.603 and 0.462 with p<.001, respectively). Interpersonal Dynamics Index did not have a significant correlation with an individual’s level of education, gender, age and length of relationship.

Relationship Outcomes

Using 5 items to assess global satisfaction, sense of thriving and fit, 75% and 69% of the total variance was explained using the Initial Eigenvalues and Extraction Sums of Squared Loadings, respectively. Cronbach’s alpha in the reliability analysis was 0.916. These three relationship outcomes were highly correlated with couple satisfaction as measured by CSI (r = 0.804, p<.001), dyadic adjustment as measured by RDAS (r = 0.728, p<.001), Eros and Agape types of love (r = 0.665 and 0.386 with p<.001, respectively).

Emergent Love Scale

After confirmatory factor analysis, two factors and 17 items were identified in the following domains: global satisfaction, sense of thriving, sense of fit, mutual respect, compassion, love, trust, commitment, and physical attraction. 67% and 62% of the total variance was explained using the Initial Eigenvalues and Extraction Sums of Squared Loadings of the 2 identified factors, respectively. Cronbach’s alpha in the reliability analysis was 0.955. Emergent Love Index was highly correlated with couple satisfaction as measured by CSI (r = 0.801, p<.001), dyadic adjustment as measured by RDAS (r = 0.724, p<.001), Eros and Agape types of love (r = 0.650 and 0.443 with p<.001, respectively). Emergent Love Index did not have a significant correlation with an individual’s level of education, gender, age and length of relationship.

Sexual Health & Satisfaction Scale

After Factor Analysis, items were reduced to 6 and consisted of frequency of sex, satisfaction with the frequency of sex, satisfaction with the quality of sex, consensual sex (self and partner) as well as partner’s sexual desire. 69% and 55% of the total variance was explained using the Initial Eigenvalues and Extraction Sums of Squared Loadings, respectively. Cronbach’s alpha in the reliability analysis was 0.716. Couple satisfaction as measured by Couple Satisfaction Index was moderately correlated with both factors of SHS Score (Pearson correlation coefficient of .443, p<.001). SHS score did not have a significant correlation with an individual’s level of education and gender; however, there was a weak but statistically significant negative correlation between SHS and the individual’s age and length of their relationship.

Other Scales and Measures

For more information on the validity and reliability of other scales and measures, please refer to the technical manual available on clinician-specific area of the website.

Core Outcomes

Sexual Satisfaction

Health & Wellbeing

Interpersonal Dynamics

Mutual Physical Attraction

Ability to Connect

Healthy Financial Attitude

Moral Values

Positive Emotions

Positive Thinking